Make a public transport map of any location
How well is a site connected by bus and rail? Plantaube draws the transit network around any place, with stops and line colours, on a calm base map.
Start with this templateOpens Plantaube with the template applied. Free, no sign-up.
What the transit map shows
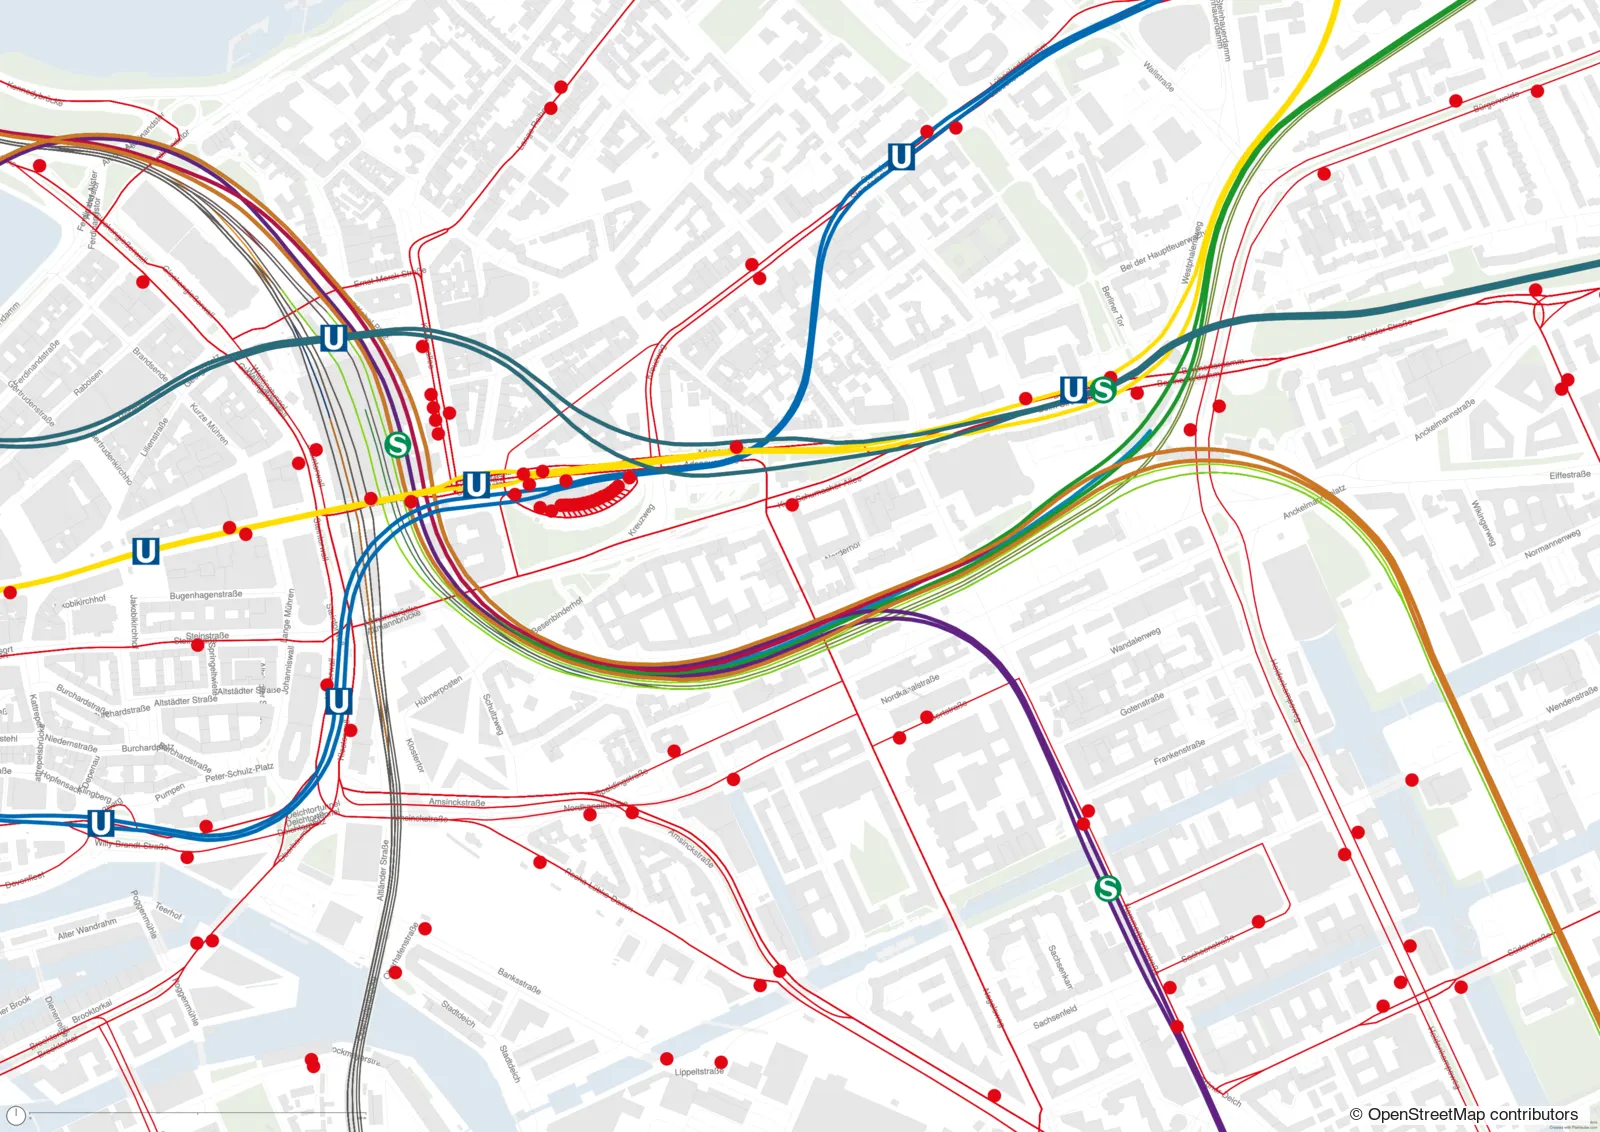
Plantaube loads public transport lines from OpenStreetMap: metro (U-Bahn), suburban rail (S-Bahn), tram and bus as well as regional and long-distance rail, plus their stops and stations.
Each line is drawn in its own colour where OpenStreetMap has one, otherwise in the colour of its mode. Parallel tracks of one line are merged into a single line, and metro and suburban rail stations get their own symbols. You can hide or recolour individual lines.
What it’s for
Site analysis
Show how a plot or neighbourhood is served by bus and rail.
Property listings
Make good connections visible as a selling point.
Mobility plans
A base for mobility and transport concepts in planning projects.
How to make it in Plantaube
- 1Search for a place and choose the extent – a scale such as 1:10,000 suits a line network.
- 2Click “Continue to Adding Layers”: the base map and transit lines load.
- 3In the “Public Transport” layer, adjust modes, individual lines, colours and stop symbols.
- 4Export as PDF, SVG or PNG.
Frequently asked questions
Which modes are shown?
Metro, suburban rail, tram, bus and regional/long-distance rail. Ferries can be switched on, and each mode can be hidden on its own.
Does it work outside Germany?
Yes. The data comes from OpenStreetMap and is available worldwide. How complete it is depends on how well the local network is mapped.
Can I change the line colours?
Yes. Set a colour per mode, or recolour and hide each line individually.
More plan types
Site plan
The colourful Plantaube standard: buildings, trees, green space, water and land use.
Aerial photo plan
Official aerial photo with building outlines – to scale.
Figure-ground plan
The urban fabric at a glance: black buildings on a white ground.
Parcel map
Official German cadastral parcels (ALKIS) with numbers, buildings and house numbers.
Urban design plan with shadows
Building masses with floor counts and cast shadows – competition style.
Property location map
A neighbourhood map for listings, with the property highlighted.
Dark site plan
Greyscale on a dark ground – for presentations and screens.